

Prolonged Lifespan: Is It Attributable to Meat Consumption or Other Factors?
The article Total Meat Intake is Associated with Life Expectancy: A Cross-Sectional Data Analysis of 175 Contemporary Populations by You [*] examined the association between meat intake and life expectancy at a population level based on ecological data published by the United Nations agencies. Their results were
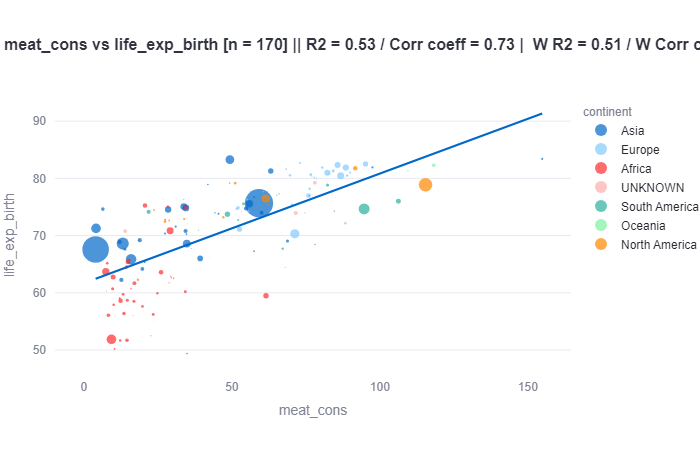
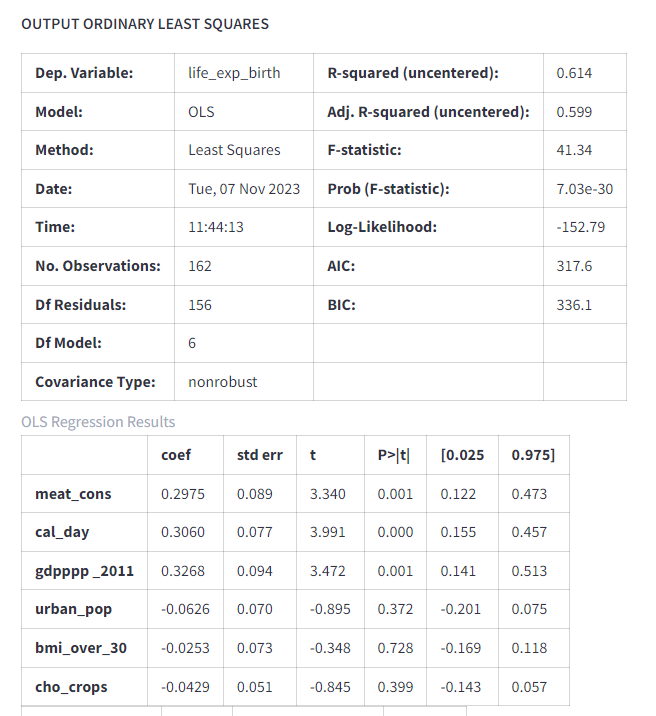
Worldwide, bivariate correlation analyses revealed that meat intake is positively correlated with life expectancies. This relationship remained significant when influences of caloric intake, urbanization, obesity, education and carbohydrate crops were statistically controlled. Stepwise linear regression selected meat intake, not carbohydrate crops, as one of the significant predictors of life expectancy
They also mentioned:
Thirdly, GDP PPP may be a comprehensive life expectancy contributor. For instance, populations with greater GDP PPP may have higher meat affordability, better medical service and better education level. Each factor may contribute to life expectancy in its unique way, but it is impossible to collect all these data and include them as the potential separate confounders in the data analyses to remove their competing effects on life expectancy.
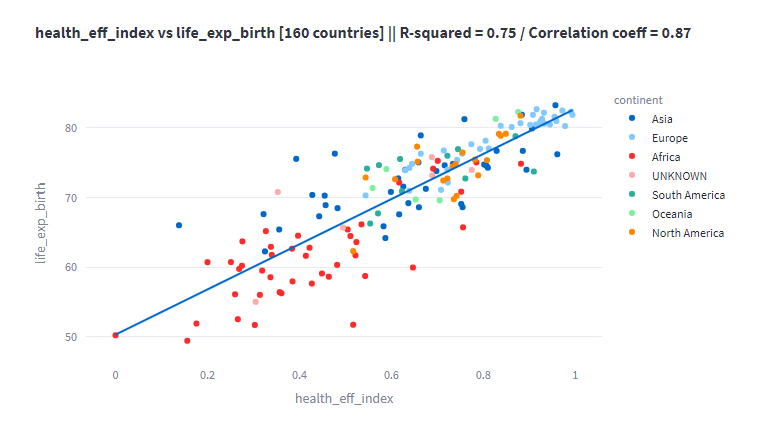
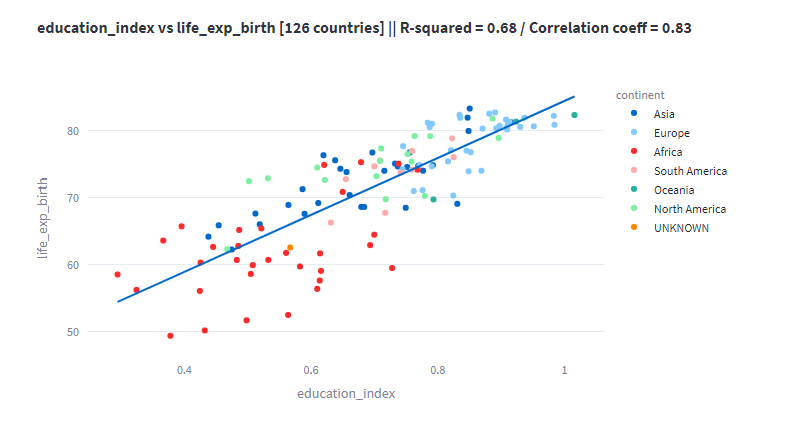
I tried to study the influence of better medical service and better education level.
Method
Supplementary data sources have been procured and are duly cited in the sources section. The analysis was executed using Python in conjunction with statsmodels and Streamlit [code], the resultant page is accessible at the following location: https://rcsmit.streamlit.app/?choice=26
At first some scatter plots were made. The original study contained only the first one.
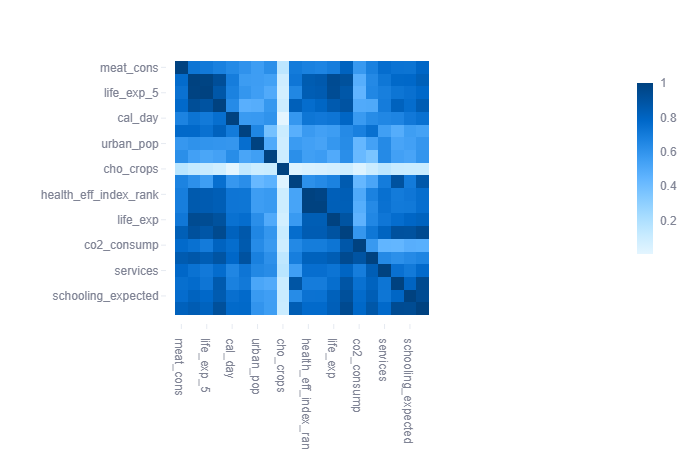
A correlation heatmap with the additional datasources was made
A standard multiple regression is made. Like in the original study the values has been log normalized. After that the data was standardized by Z-score normalization to the selected columns.
First it is done with all the countries like in the study. The results aligned with those presented in Table 3 of the original study.
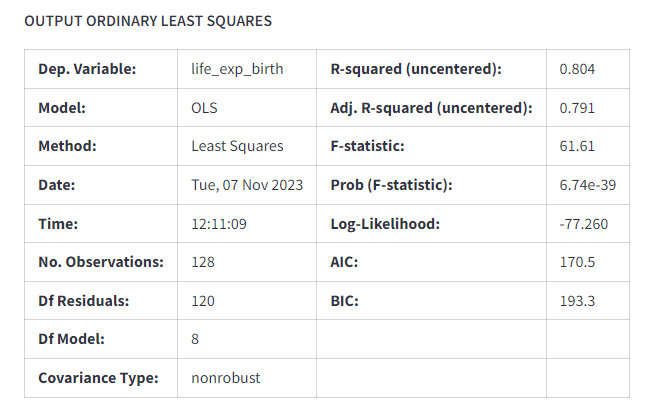
Subsequently, health index and education index were included in the analysis.
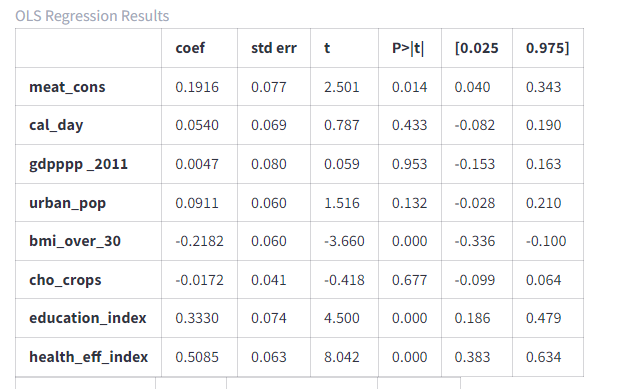
The coefficients obtained were as follows: meat consumption (0.1916), health index (0.3330), and education index (0.5085). These coefficients imply that health and education have a more significant influence on life expectancy than meat consumption.
In contrast to the original study, a weighted linear regression was performed in this analysis. The weight factor is determined by the population size.
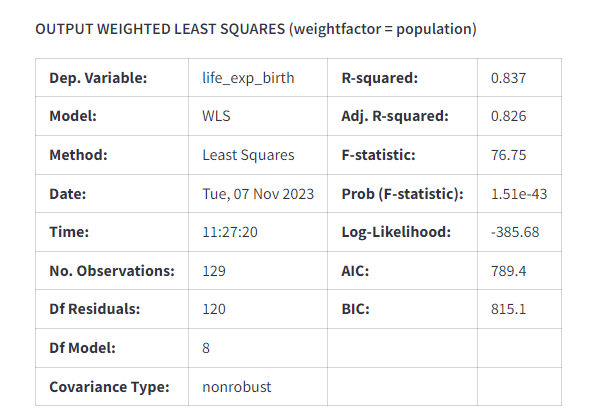
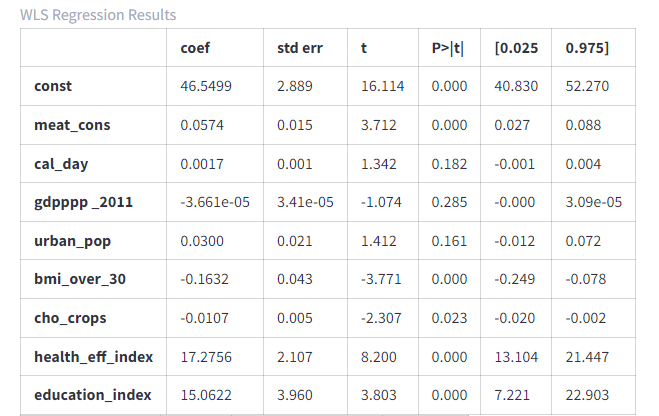
The obtained coefficients were as follows: meat consumption (0.0574), health index (17.2756), and education index (0.150622). These coefficients indicate that health and education exert an even more pronounced influence on life expectancy compared to meat consumption.
Additional analysis: addressing multicollinearity
A well known limitation of the regression model: all variables are interrelated. Rich countries eat more meat AND have better hospitals AND better education. When correlated variables compete in the same model, the coefficients become unreliable — you cannot tell what is actually driving what. This is known as multicollinearity.
To address this, an additional analysis using principal component analysis (PCA) is ran. Rather than treating eight variables separately, PCA asks: which of these always move together? Those shared patterns are summarised into a small number of “components.”
Three components emerged, together explaining 80.9% of all variation in the data across 129 countries.
Component 1 — general development accounts for more than half of all variation. It is an almost equal mix of meat consumption (0.40), GDP (0.40), calories (0.39), education index (0.39), and health index (0.36). All of these move together. Meat is statistically indistinguishable from this general development factor — you would get the same result using internet connections or car ownership per capita instead.
Component 2 — grains or no grains is almost entirely dominated by carbohydrate crops (0.99). Countries like Bangladesh and Ethiopia live primarily on grains and score low on most other indicators.
Component 3 — growing richer faster than healthcare can keep up captures countries that urbanize rapidly with rising obesity while healthcare infrastructure lags behind. This was the only component that proved a statistically significant predictor of life expectancy beyond general wealth — and it has nothing to do with meat consumption.
The loadings table (Figure A) shows the numbers behind this. The biplot (Figure B) makes the pattern visible: seven of the eight variable arrows cluster together along the horizontal axis, pointing in the same direction as meat consumption. This clustering is the visual proof that meat, GDP, education, and healthcare are not independent variables — they are all expressions of the same underlying phenomenon.
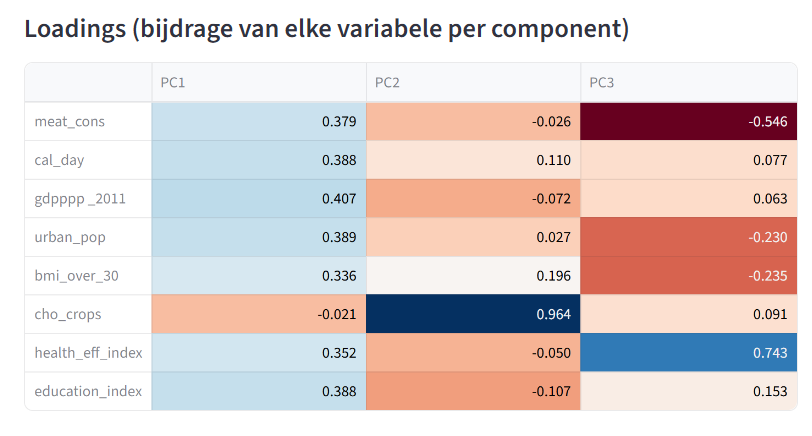
Loadings table from the principal component analysis. Component 1 loads almost equally on meat consumption, GDP, calories, education index, and health index — confirming that these variables all measure the same underlying phenomenon: general development.
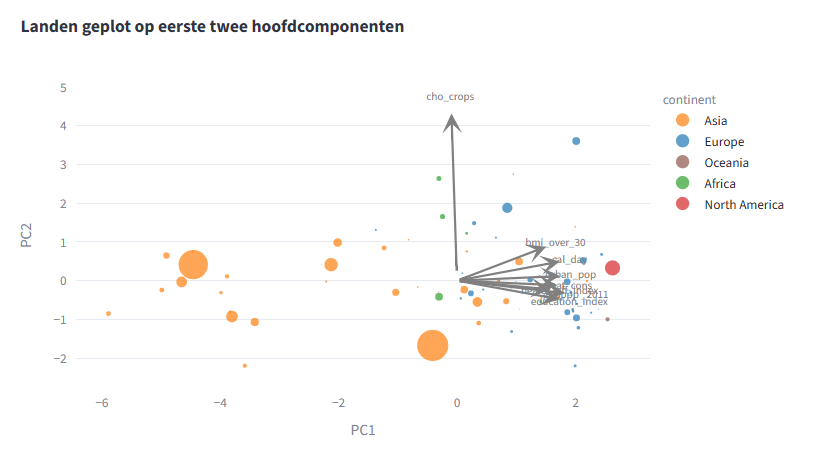
Biplot showing 129 countries positioned by their scores on the first two components. Dot size reflects population. The arrows show each variable’s direction and strength. Seven of the eight arrows cluster along the horizontal axis alongside meat consumption, confirming that meat, GDP, education, and healthcare are not independent predictors.
Conclusion
In conclusion, this study indicates that healthcare quality and education play a more substantial role in influencing life expectancy when compared to meat consumption.
Also the PCA confirms this conclusion, but now without the methodological doubt. Meat correlates with longer life because rich countries happen to eat more meat. That is not evidence that meat makes you live longer. The real predictors are healthcare, education — and the ability to ensure that growing prosperity is matched by adequate medical infrastructure.
Discussion
The final regression analysis was conducted with a reduced number of countries due to incomplete and outdated data from different years. To enhance the robustness of the findings, it is recommended that this analysis be repeated with more comprehensive and up-to-date data.
A further limitation of multiple linear regression is that it assumes all predictor variables are independent of each other. In this case, meat consumption, health index, and education index are all related to overall development — a problem known as multicollinearity. The additional PCA analysis below addresses this directly and confirms that the conclusion holds under a more rigorous method.
Remarks
It is worth mentioning that upon reviewing the authors’ previous work, no other publications on a similar topic were identified. This suggests that this study may have been conducted independently and on a relatively ad hoc basis.
Links
For a critical examination of the methodology employed in this study, please refer to the provided link:
MEAT INTAKE & LONGEVITY, OR FOOD SUPPLY & BIRTH LIFE EXPECTANCY?
Data Sources
Meat consumption etc. : https://www.ncbi.nlm.nih.gov/pmc/articles/PMC8881926/ (appendix 1)
- newborn life expectancy (e(0)), life expectancy at 5 years of life (e(5)) and intakes of meat, and carbohydrate crops, respectively. The established risk factors to life expectancy — caloric intake, urbanization, obesity and education levels — were included as the potential confounders.
Gapminder data set, values from 2018 : https://www.kaggle.com/datasets/albertovidalrod/gapminder-dataset?resource=download
- Country (country). Describes the country name
- Continent (continent). Describes the continent to which the country belongs
- Year (year). Describes the year to which the data belongs
- Life expectancy (life_exp). Describes the life expectancy for a given country in a given year
- Human Development Index (hdi_index). Describes the HDI index value for a given country in a given year
- — — The Human Development Index (HDI) is a statistical composite index of life expectancy, education (mean years of schooling completed and expected years of schooling upon entering the education system), and per capita income indicators, which is used to rank countries into four tiers of human development.
- CO2 emissions per person(co2_consump). Describes the CO2 emissions in tonnes per person for a given country in a given year
- Gross Domestic Product per capita (gdp). Describes the GDP per capita in dollars for a given country in a given year
- % Service workers (services). Describes the the % of service workers for a given country in a given year
Health Efficiency Index : https://web.archive.org/web/20200313135813/https://www.who.int/healthinfo/paper30.pdf
- Factors : 25% for health (DALE), 25% for health inequality, 12.5% for the level of responsiveness, 12.5% for the distribution of responsiveness, and 25% for fairness in financing.
Education: https://ourworldindata.org/human-development-index
- Mean years of schooling estimates the average number of years of total schooling adults aged 25 years and older have received. This data extends back to the year 1870 and is based on the combination of data from Lee and Lee (2016); Barro-Lee (2018); and the UN Development Programme. Fifteen is the projected maximum of this indicator for 2025.
- Expected years of schooling measures the number of years of schooling that a child of school entrance age can expect to receive if the current age-specific enrollment rates persist throughout the child’s life by country. Eighteen is equivalent to achieving a master’s degree in most countries.
- education_index = ((schooling_expected / 18) + (schooling_mean / 15) )/2
Country codes and info: https://countrycode.org/