Abstract
This study presents a novel approach to analyzing excess mortality during the COVID-19 pandemic using quadratic curve fitting. By comparing linear and quadratic models applied to pre-pandemic mortality data, we demonstrate that quadratic fitting results in lower estimates of excess mortality for the years 2020 and beyond. This finding suggests that previous linear extrapolations may have overestimated the impact of the pandemic on mortality rates.
Introduction
The accurate estimation of excess mortality during public health crises is crucial for understanding the full impact of events such as the COVID-19 pandemic. Traditional methods often rely on linear extrapolations of pre-crisis trends, which may not capture the complex, non-linear nature of long-term mortality trends. This study introduces a quadratic fitting approach to address this limitation and provide a more nuanced analysis of excess mortality.
Methods
We developed a Streamlit-based application [script] to analyze mortality data across various age groups and genders. The analysis pipeline includes the following key steps:
- Data preparation: Mortality data was obtained for different age groups and genders, covering years before and including the pandemic period.
- Model fitting: Two models were applied to pre-2020 data:
a) Linear trend (OLS regression)
b) Quadratic curve fitting
Also exponential fitting is possible in the application. - Projection: Both models were used to project expected mortality rates for 2020 and beyond.
- Excess mortality calculation: The difference between observed and projected mortality rates was calculated for both models.
- Comparative analysis: Results from linear and quadratic models were compared across different age groups, start years, and data types (absolute numbers and per 100,000 population rates). The per 100,000 population rate is extrapolated to the complete population
Results
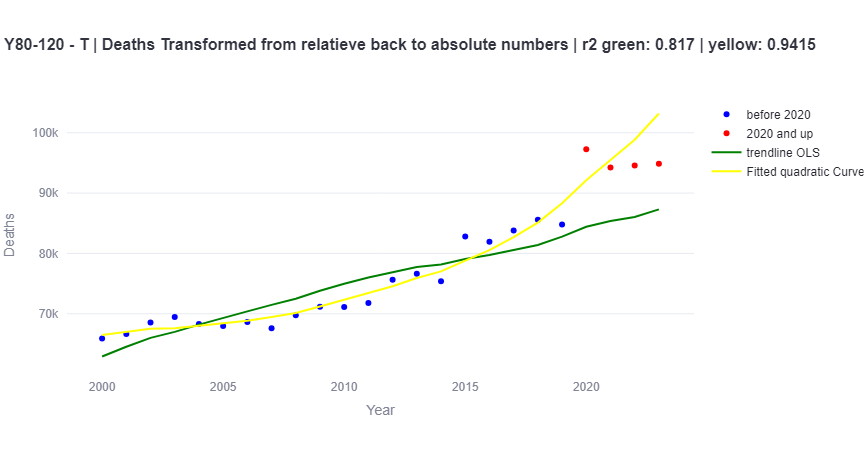
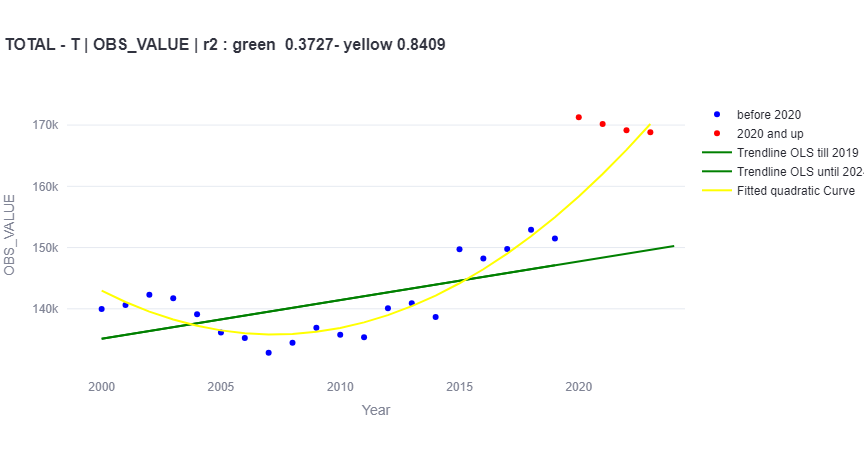
Our analysis revealed consistently lower estimates of excess mortality when using quadratic fitting compared to linear trend extrapolation in most cases. This pattern was observed across various age groups and regardless of whether the analysis was performed on absolute mortality figures (OBS_VALUE) or population-adjusted rates (per100k) , which were then extrapolated to the entire population..
Key findings include:
- Overall mortality (TOTAL):
- For 2015 data, quadratic fitting estimated 52,802 excess deaths compared to 63,015 with linear fitting.
- This pattern was consistent across different start years (2000, 2010, 2015).
- Age group variations:
- For the 90+ age group, quadratic fitting showed lower excess mortality for 2000 and 2010, but higher for 2015.
- In the 0-49 age group, quadratic fitting consistently showed lower excess mortality across all years.
- Start year impact:
- The choice of start year significantly affected estimates. For example, in the 65-79 age group:
- 2000 start: 41,862 (linear) vs 7,102 (quadratic)
- 2010 start: 19,525 (linear) vs 17,114 (quadratic)
- 2015 start: 23,224 (linear) vs 11,857 (quadratic)
- The choice of start year significantly affected estimates. For example, in the 65-79 age group:
- Per 100k population rates:
- Similar patterns were observed in per 100k rates, with quadratic fitting generally producing lower estimates.
- For the total population in 2015: 61,248 per 100k (linear) vs 52,784 per 100k (quadratic)
- Age-specific findings:
- In some age groups, like 80+, quadratic fitting showed higher excess mortality for recent years (2010, 2015) but lower for 2000. With quadratic fitting there is even under mortality of 2174 per year if calculated per 100k and from 2000. (see figure)
- Younger age groups (0-4, 5-9) showed minimal differences between methods.
These results demonstrate that the choice of fitting method can significantly impact excess mortality estimates, with quadratic fitting generally producing lower estimates than linear extrapolation.


Discussion
The lower excess mortality estimates obtained through quadratic fitting suggest that the impact of the COVID-19 pandemic on overall mortality rates may have been overestimated by simpler linear projection methods. This finding has several important implications:
- Pandemic impact assessment: Our results indicate that the choice of statistical model can significantly affect excess mortality estimates. For instance, the total excess mortality estimate for 2015 was about 16% lower using quadratic fitting compared to linear extrapolation.
- Age-specific considerations: The differences between linear and quadratic estimates vary across age groups. This suggests that the impact of the pandemic, and our ability to accurately measure it, may differ by age cohort.
- Long-term trend analysis: The number of deaths does not continue to increase quadratically indefinitely. There will eventually be an inflection point where the curve changes from convex to concave, and a peak will come into view. The problem is that we do not know where this inflection point lies, and it may have already been reached.[*] [see also this article]
- Extrapolation at the extremes: While a quadratic fit may work better for the included data points, it can lead to significant deviations at the extremes where we extrapolate. The further we extrapolate from our data, the less reliable our predictions become, and this effect can be more pronounced with quadratic fitting than with linear extrapolation. [*]
- Complexity: The superiority of quadratic fitting in capturing pre-pandemic trends for most age groups suggests that mortality rates may follow more complex patterns than previously assumed, necessitating more sophisticated modeling approaches.
- Model selection considerations: The choice between linear and quadratic models (or potentially other forms of non-linear models) should be based not only on the fit to historical data but also on our understanding of the underlying mechanisms driving mortality trends. A better fit to historical data does not necessarily translate to better predictive power, especially when extrapolating beyond the range of observed data.
- Potential for overfitting: Quadratic models, being more complex than linear models, have a higher risk of overfitting the historical data. This could lead to capturing noise rather than true trends, potentially resulting in less reliable extrapolations.
- Start year sensitivity: The substantial differences in estimates based on the start year (2000, 2010, or 2015) highlight the importance of considering different historical baselines in mortality trend analysis.
- Policy implications: More accurate and nuanced excess mortality estimates can inform more targeted and proportionate public health interventions in future crises, potentially tailored to specific age groups.
These considerations underscore the need for caution when interpreting the results of our quadratic fitting approach. While it offers valuable insights and potentially more accurate short-term predictions, its long-term extrapolations should be treated with skepticism. Future research should explore methods to identify potential inflection points in mortality trends and develop more sophisticated models that can account for changing trends over time.
It is crucial to note that the author of this study does not doubt or deny the existence of COVID-19, its significant impact on healthcare systems worldwide, or the effectiveness and safety of vaccines developed to combat the virus. The purpose of this research is solely to improve the accuracy of mortality trend analysis and excess mortality estimation. The COVID-19 pandemic has undeniably caused substantial disruption to global health, economies, and societies. Vaccines have played a critical role in mitigating the impact of the virus, and their safety and efficacy have been demonstrated through rigorous clinical trials and real-world evidence.
The findings of this study should be interpreted as a refinement of statistical methods rather than a challenge to the established understanding of the pandemic’s severity. By improving our analytical tools, we aim to enhance our ability to accurately assess and respond to public health crises, while fully acknowledging the real and significant challenges posed by COVID-19.
Limitations
While our quadratic fitting approach offers valuable insights, it is important to acknowledge its limitations:
- The model assumes that pre-pandemic trends would have continued in the absence of the pandemic, which may not account for other potential disruptions or changes in mortality determinants.
- The analysis is sensitive to the choice of start year and the length of the pre-pandemic period included in the model fitting.
- Quadratic fitting, while more flexible than linear trends, may still not capture all complexities in long-term mortality trends.
Conclusion
This study demonstrates that quadratic fitting of mortality trends generally results in lower estimates of excess mortality during the COVID-19 pandemic compared to traditional linear extrapolations. However, we must interpret these results with caution, particularly for long-term projections.
These findings suggest a need for more nuanced approaches to mortality trend analysis and caution against over-reliance on simplistic linear projections.
The significant variations observed across age groups and start years underscore the complexity of mortality trends and the importance of considering multiple analytical approaches. Future research should explore additional non-linear modeling techniques, incorporate a wider range of factors that may influence mortality trends over time, and investigate why certain age groups show different patterns between linear and quadratic models.
By refining our analytical methods, we can improve our understanding of the true impact of major health events like the COVID-19 pandemic, leading to more informed and effective public health strategies
.Author’s Note: This article was generated by an AI assistant (ClaudeAI) based on provided code and instructions. [*]The human author has reviewed the content and fully agrees with its substance and conclusions.
