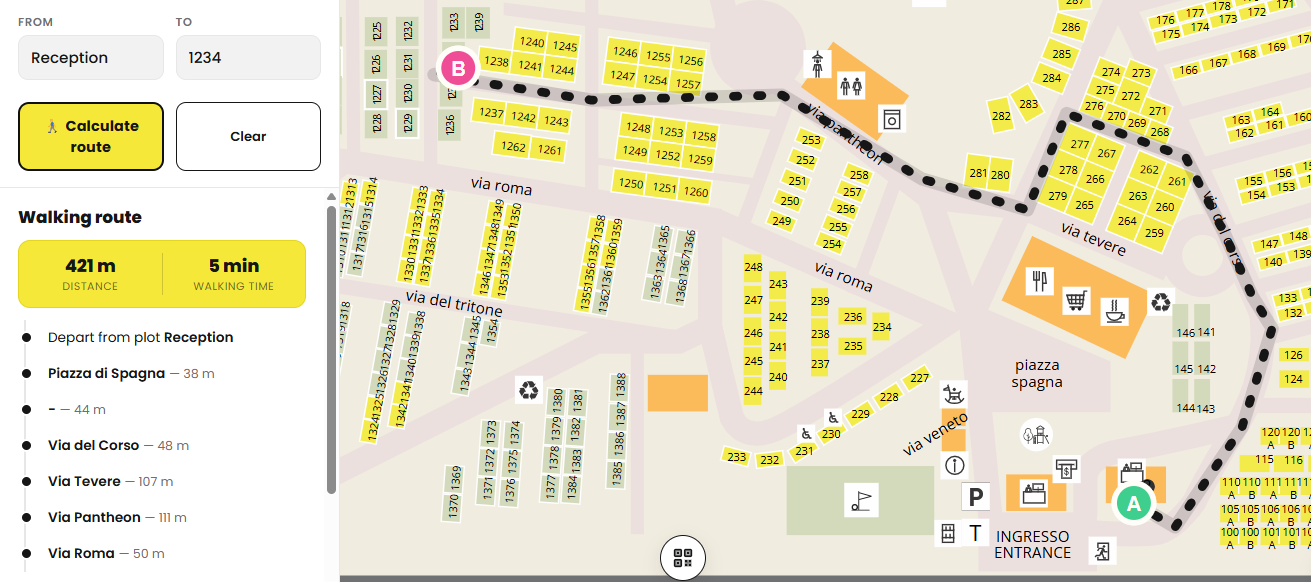
Every summer at Fabulous Village, the same question gets asked at reception a hundred times a day: “Which way to pitch 1104?” The official site plan is a lovely piece of graphic design, but it’s not a map you can search. So I built one — a small web app where you type in a pitch number (or the entrance, 000) and a destination, and it draws you the walking route, with distance and an estimated walking time.
This post is about how it’s built: a background image, a graph of paths laid on top of it, and one very old algorithm doing the actual work.
Where it started: an AI-generated first draft
Full transparency: the very first version of this wasn’t hand-typed. I uploaded the campsite’s PDF site plan to an AI and asked it to sketch out a routing app from it. What came back was rough — the nodes were off, several streets weren’t connected properly, and the shortest-path logic had bugs.
What it did give me was a skeleton to react to instead of a blank page: the idea of three plain data structures (nodes, edges, plots), a first (buggy) attempt at shortest-path routing, and the general shape of “SVG map with an invisible graph drawn on top.” From there it wasit was a matter of manually re-tracing some paths by hand, building the config tool described further down, and rewriting most of the routing logic myself. So: AI-assisted start, hand-reviewed everything that actually needed to be correct.
The idea: turn a picture into a graph
The site plan itself is “just” an SVG — an image. Images don’t know anything about paths, intersections, or how far it is from pitch 401 to the reception. To make routing possible, I had to lay an invisible graph on top of the picture: a set of points (path junctions) connected by lines (path segments), each with a name (the street) and a length.
That gives three ingredients, and the whole app is built out of nothing more than these three JavaScript constants:
NODES — every junction or bend in a path, as an {id: [x, y]} pair of pixel coordinates on the map.
EDGES — every path segment, as [fromNodeId, toNodeId, streetName] triples connecting two nodes.
PLOTS — every pitch (and the reception, the gelateria, etc.), each with a number, a color, an (x, y) position, and the nearest node it’s attached to.
Once you have that, “how do I get from pitch A to pitch B” turns into a textbook graph problem: walk from the node nearest A to the node nearest B, using the combination of edges that adds up to the smallest total length. Which brings us to the box below.
📐 Math box: Dijkstra’s algorithm
The routing itself is Dijkstra’s shortest-path algorithm, from 1956 — one of the oldest, most-used algorithms in computer science. In plain terms: you’re standing at one point in a network of connected points, each connection has a “cost” (here, a distance in meters), and you want the cheapest possible route to some other point.
The intuition first. Imagine you’re at the start pitch, and you don’t know the map yet — you only know which paths lead directly away from you, and how long each one is. A reasonable way to explore is: always go check out the closest place you haven’t visited yet, before bothering with anything farther away. Once you’ve visited a place by the shortest possible route, you can stop worrying about it — nothing you discover later can ever give you a shorter way to reach it, because every extra step you take can only add distance, never subtract it. That one observation — “the closest not-yet-visited point is already final” — is the whole trick that makes the algorithm work, and it’s why it’s allowed to be greedy (always taking the locally-best option) without ever having to backtrack and reconsider.
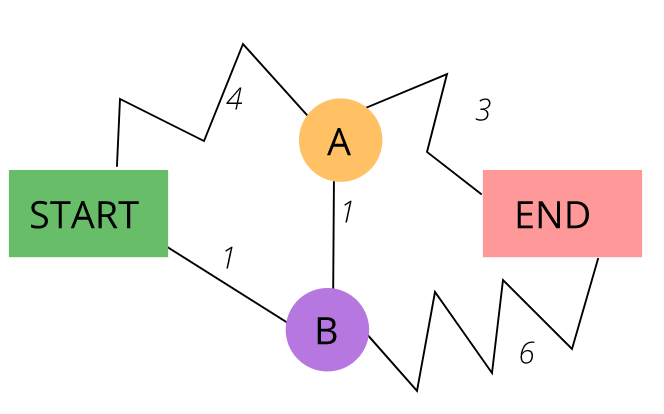
A tiny worked example. Say you have four nodes: Start, A, B, End, with paths (and their lengths) Start–A: 4, Start–B: 1, B–A: 1, A–End: 3, B–End: 6.
We know Start = 0, and everything else is “unknown” (∞) for now.
Closest unvisited node to Start: B, at distance 1. We visit it. From B we can reach A in 1 + 1 = 2 (better than the 4 we’d get going Start→A directly, so we update A’s distance to 2) and End in 1 + 6 = 7.
Next-closest unvisited node: A, at distance 2. We visit it. From A we can reach End in 2 + 3 = 5 — better than the 7 we had, so End’s distance drops to 5.
Next-closest: End, at distance 5. Done — 5 is the shortest possible distance from Start to End, via Start→B→A→End.
Notice that we never had to reconsider B or A once we’d visited them, even though we kept finding new ways to reach other nodes through them — that’s the greedy guarantee in action.
The same idea, written as a repeatable recipe (this is what the code below does):
Give the start node a distance of 0, and every other node a distance of ∞ (unknown).
Repeatedly pick the unvisited node with the smallest known distance so far (in the example: first B, then A, then End).
Look at all of its neighbours. For each neighbour, check whether going through the current node beats what we currently know about it (this step is called relaxing the edge, because it “loosens” an overly-pessimistic distance estimate down to something better): if distance[current] + weight(current, neighbour) < distance[neighbour]: update it
Mark the current node as visited (its distance is now final — see the intuition above for why that’s safe), and repeat until every node has been visited (or you’ve reached the destination).
This only works because every edge weight here is a plain Euclidean distance (√(Δx² + Δy²), computed straight from the node coordinates) — distances are never negative. That matters because the whole “closest unvisited node is already final” shortcut silently assumes nothing can make a path shorter by adding more steps to it; a negative edge weight (which would mean “walking further makes you closer,” nonsensical for an actual footpath) would break that assumption entirely.
In code, it’s barely 20 lines:
function dijkstra(start) {
  const dist = {}, prev = {}, visited = {};
  for (const k in NODES) dist[k] = Infinity;
  dist[start] = 0;
  const queue = [[0, start]];
  while (queue.length) {
    queue.sort((a, b) => a[0] - b[0]);   // pick smallest distance
    const [d, u] = queue.shift();
    if (visited[u]) continue;
    visited[u] = true;
    adjacency[u].forEach(edge => {
      const nd = d + edge.weight;
      if (nd < dist[edge.to]) {
        dist[edge.to] = nd;
        prev[edge.to] = { node: u, street: edge.street };
        queue.push([nd, edge.to]);
      }
    });
  }
  return { dist, prev };
}
That prev map is the trick for turning “distances” into an actual route: for every node, it remembers which neighbour and which street you’d have come from on the shortest path. So once Dijkstra finishes, reconstructing the walking directions is just: start at the destination, follow prev backwards until you’re home, then reverse the list.
A confession about complexity. Sorting the whole queue on every loop (as above) is not how you’d do this at scale — it costs O(V²·log V)-ish work, versus O((V + E)·log V) with a real binary heap / priority queue. Here, O(…) just means “roughly proportional to” — it describes how the amount of work grows as the graph grows, ignoring constant factors and focusing on what dominates at large scale. V is the number of nodes (junctions), and E is the number of edges (path segments). So V²·log V means: if you double the number of nodes, the work needed roughly quadruples (that’s the V² part), plus a bit more from the slow-growing log V factor. (V + E)·log V grows much more gently — closer to linear. For a campsite with a few hundred nodes, the difference is invisible (the whole route is computed in a few milliseconds), so I kept the simple version. If this were routing a whole city, I’d reach for a heap — or for A*, which is Dijkstra plus a straight-line-distance hint toward the destination, so it stops exploring in the wrong direction.
From graph to guest-facing app
With NODES, EDGES and PLOTS in hand, the public page does three things:
Look up the plot the visitor typed (or clicked), and find the node it’s attached to.
Run Dijkstra from the start node, and read off the path to the destination node.
Convert the result from “abstract graph units” into something a human cares about: meters and minutes.
M_PER_UNIT is a calibration constant — pixels on the SVG map don’t naturally mean anything in the real world, so I measured a known real-world distance on-site and divided to get “meters per map unit.” WALK_SPEED is just an assumed walking pace (1.3 m/s, a fairly relaxed adult stroll — including in flip-flops, carrying a bag of croissants).
The unglamorous part: drawing and correcting the graph by hand
Here’s the thing nobody tells you about “just draw a graph over a map”: somebody has to actually place or correct every node and trace every path, by hand, over a real site plan with a few hundred pitches on it. Doing that by directly editing a JSON object in a text editor would have been miserable — and worse, error-prone in a way that’s invisible until a guest gets sent on a 400-meter detour because one edge was accidentally drawn between the wrong two nodes.
Luckily AI helped me by making a first setup. But that wasn’t perfect at all.
So before I built the guest-facing app, I built myself a second tool: a graph editor that sits directly on top of the same map, lets me click to add nodes, click two nodes to connect them, click to drop a pitch marker, and — critically — flags edges that look statistically “off” (much longer than similar paths on the same street, for instance) so I can go back and check them by eye.
How to set it up (or replicate it for another site)
The whole project is two self-contained HTML files that share the same three pieces of data — no build step, no backend, no dependencies:
File
Who uses it
What it’s for
index.html
Guests
The public walking-route finder
map-config-tool.html
Admins
The visual graph editor used to build/fix the data
The one rule that matters more than any other:NODES, EDGES, and PLOTS must be copy-pasted into both files after every editing session. index.html needs current data to route guests correctly. map-config-tool.html needs current data too, or the next person to open it edits a stale graph — this is, by a wide margin, the most common source of bugs in this setup.
Rough setup order for a new campsite:
Get a background map. An SVG (or SVG-able) version of the official site plan, dropped into the <svg id="mapSvg" viewBox="0 0 W H"> element in both files. Note the exact width/height for step 2.
Update the viewbox constants (VBW, VBH) in both files to match the new SVG exactly, and update the page title/header text. Get the viewbox wrong and zoom/pan/fit-view will all drift.
Reset the three constants to empty (NODES = {}, EDGES = [], PLOTS = []) and open map-config-tool.html.
Read the map with AI: I simply uploaded the map and AI made a collection of nodes, edges and plots.
Correct the graph: add-node mode to lay down every junction/bend, add-edge mode to connect them (same street name per path, so the outlier-detection can group them), add-plot mode to drop pitch markers. Check the flagged edges list as you go — it catches most tracing mistakes automatically.
Export early and often. There’s no autosave; a refresh loses everything. Use Export → Copy all three regularly as a checkpoint.
Calibrate distance and speed in index.html: M_PER_UNIT = (known real-world distance) / (pixel distance between two nodes), and set WALK_SPEED (m/s) to a sensible walking pace for your guests.
Copy the final export into index.html — and paste the same block back into map-config-tool.html too, so it isn’t left holding a stale snapshot for the next editing session.
For anyone in the camping group wanting their own version: publish only index.html (that’s the guest-facing file), keep map-config-tool.html private since it lets anyone editing it change the live graph, and give each campsite its own pair of files rather than sharing one live copy.
As a hospitality and leisure professional, I hate handwritten notes. So the first thing I do when I work in a new place is make a door sign like “We’ll be back in a minute.” But what if your colleague from another campsite sees it and wants one too? And then their colleague? I’m too…
I had a folder with thousands of PDFs. Invoices next to yoga manuals next to scanned maps next to bank statements. Filenames like xkbf2291.pdf and 00183774.pdf. No structure whatsoever. Manually sorting them wasn’t happening. So I built a Python script that reads each file, sends the content to Claude, and moves everything into topic folders…
Instagram has a “Collections” feature — you can save reels and posts into named folders. Handy for yourself. Useless for anyone else, because there’s no way to share a collection with another person. No link, no export, nothing. I wanted to share a list of handstand, acro and Berlin reels with a few people without…
A few weeks ago I found a .doc file on an old backup drive. Created in 1994. Password protected. An old document I had written myself — and I had absolutely no idea what the password was anymore. Here’s how I got it back. Disclaimer: These techniques are for recovering your own files only. Applying…