Replication of Cumulative Rainfall Deficit Chart in the Netherlands
On Twitter, a chart of the cumulative rainfall deficit was posted, presenting a challenge to replicate it.
Rainfall deficit is an important metric in hydrology and agriculture, representing the difference between the amount of precipitation and evaporation. When evaporation exceeds precipitation, a rainfall deficit occurs, leading to drought and problems for crops and water management.
This document describes the methodology to calculate and visualize the rainfall deficit in the Netherlands. We discuss the calculations for evaporation, the conversion factors required for the data used, and the selection of measurement stations.
Subsequently, the data analysis is performed using Python, and the results are presented in the form of charts. The reader gains insight into how the calculations were performed, which data was used, and what the results mean for monitoring drought in the Netherlands.

Methodology
An explanation of the calculation method, procedure, and some adjustments follows.
NB: The KNMI also gives the daily evaporation in the daily statistics as EV24. See the addendum.
Evaporation Calculation
Reference crop evaporation is the amount of water that evaporates from a grass field that is well-supplied with water and nutrients. This value is used in hydrology as a basis to calculate how much water evaporates from land surfaces with various types of crops.
Since April 1, 1987, the KNMI has been calculating reference crop evaporation using the Makkink formula.
The equation is:

Where:
- λ= latent heat of vaporization of water (2.45 * 1⁰⁶ J/kg at 20 degrees Celsius)
- Eref = reference crop evaporation (kg/(m²·s))
- 𝐶₁ = constant (De Bruin (1981) found a value of approx. 0.65)
- 𝐶₂ = constant (De Bruin (1981) found a value of approx. 0)
- 𝐾ᵢₙ = shortwave incoming radiation (W/m²)
- γ = psychrometer constant (approx. 0.66 mbar/°C at sea level)
- s = derivative with respect to temperature of the saturation vapor pressure (mbar/°C)
- T= temperature (°C)
s can be calculated with:

With a = 6.107mbar, b = 17.294, c = 237.7°C, and T = temperature in degrees Celsius.
Ultimately, after using conversion factors:
rainfall deficit=reference crop evaporation−cumulative precipitation
To work with the daily values from the KNMI, two conversion factors and an adjustment are needed.
Reference Crop Evaporation
The unit of Eref from the formula is kg/(m²·s). To convert this to mm/day, a factor of 86,400 is needed. 1 kg/(m²·s) is equivalent to 1 mm/s (1 kg of water on 1 m² of surface represents 1 mm water height). Additionally, there are 86,400 seconds in a day (24 hours × 60 minutes × 60 seconds).
Radiation
The radiation in the formula is expressed in W/m². The KNMI provides global radiation in J/cm². Joules (J) is a measure of energy, Watts (W) is a unit of power or energy per unit time (1 W = 1 J/s). Additionally, 10⁴ cm² = 1 m². The conversion factor is 10⁴/86400.
Temperature
The values in the charts are most comparable when using the mean temperature. It is possible that the KNMI utilizes hourly data instead of daily values. They might also apply a smoothed moving average to their calculations.
Negative Values
In the KNMI chart, the calculation is stopped if the continuous deficit reaches zero and resumes when a deficit occurs again. This is not done in the script described here.
Stations
The KNMI calculation uses the average precipitation from 13 reference stations in the Netherlands (the so-called P13 stations) and the reference evaporation calculated based on the sunshine duration in De Bilt (until 2001) or the global radiation near the P13 stations (from 2001).(*)
The P13 stations are: De Bilt, De Kooy, Groningen, Heerde, Hoofddorp, Hoorn, Kerkwerve, Oudenbosch, Roermond, Ter Apel, West-Terschelling, Westdorpe, and Winterswijk.
The P13 stations are not all available with the API of the KNMI, so the closest alternative was used. Unfortunately, there were no alternatives or missing measurement values for two stations.
The global radiation from the selected station has been included in the calculation. However, the sunshine duration is not part of the provided formula. Additionally, the temperature, although part of the used formula, does not appear to be utilized by the KNMI.
The stations used by the script are:

Data Processing
Python was used in combination with Pandas to process the data (column manipulation and cross-tabulations), Streamlit to make it web-based, and Plotly to display the charts.
The data was obtained via the KNMI daily data API, with the URL https://www.daggegevens.knmi.nl/klimatologie/daggegevens?stns={stn}&vars=TEMP:SQ:SP:Q:DR:RH:UN&start={fromx}&end={until}
where “stn” is the weather station, and “fromx” and “until” are the start and end dates in the format yyyymmdd (omit the braces).
The data is processed in a Python script, also interactively viewable (choose mode = ‘neerslag tekort meerdere’.).
Results
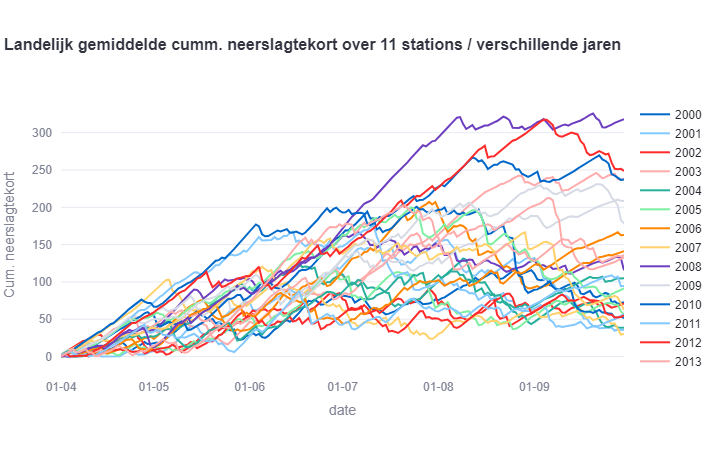
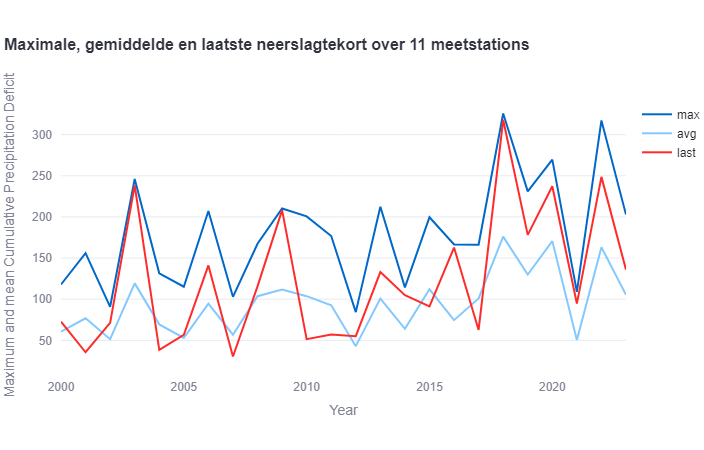
Below are the charts that speak for themselves:


Conclusions
The chart generated by the script for the year 2023 aligns closely with the corresponding chart from KNMI. While disparities in values exist across other years, the overarching trend remains consistent. It is reasonable to infer that the script demonstrates adequate utility for conducting individualized analyses.
Substantial disparities are evident among the various measurement stations. These discrepancies warrant careful consideration when drawing conclusions or devising (national) policy initiatives.
Over the past six years, a noteworthy observation emerges: four of these years exhibited drier conditions compared to preceding periods.
Addendum
It seemed that the KNMI also give the Evaporation in the daily statistics. They are somehow lower than the calculated values.


Links
- KNMI Background Information on Rainfall Deficit
- KNMI Geographical Overviews of Historical Rainfall Deficit
- Wikipedia: Reference Crop Evaporation
- GitHub: Show KNMI Functions — Rainfall Deficit
- Streamlit App — Rainfall Deficit Multiple Mode
- Groundwater Formulas
This is a showcase of my work!
I offer professional data science, infographics, and graphic design services to transform your data into actionable insights, captivating visuals, and compelling stories.
Let’s work together to make your data work for you! Contact me today to discuss how I can help you achieve your goals.
